

Interpreting AI Predictions with Confidence
One of the most valuable functions of AI in medicine is its ability to predict whether a patient has a specific condition. However, not all predictions are created equal, and it’s essential to understand how to evaluate the performance of these classification models. By mastering a few key metrics, you can confidently interpret AI-driven insights and make informed decisions about patient care.
The resources on this page break down the core concepts of classification models, including the confusion matrix, sensitivity, specificity, positive predictive value (PPV), and the Area Under the ROC Curve (AUC). These metrics provide a framework for assessing how well a model distinguishes between positive and negative cases, enabling you to understand the reliability and potential impact of its predictions.
Resources
These resources explain how to measure the performance and reliability of AI classification models in healthcare. The videos and quick guide clearly explain key metrics like sensitivity, specificity, PPV, and AUC and how to apply them.
Understanding Key Classification Metrics
In the following video, learn how to interpret an AI model’s performance using key classification metrics. Starting with the basics, the confusion matrix helps to identify true positives, false positives, true negatives, and false negatives. From there, learn how to use metrics like sensitivity to see how well the model catches positive cases, and specificity to see how well it rules out negative ones. The video also covers Positive Predictive Value, or PPV, which can confirm how reliable a positive prediction actually is. Finally, the AUC score demonstrates the model’s ability to distinguish between cases, empowering clinicians to use AI predictions with confidence.
Classification Metrics Infographic
This infographic provides a visual guide to the core metrics used in AI model classification. It defines and explains the concepts of true/false positives and negatives, Sensitivity (recall), Specificity, Positive Predictive Value (precision), Flag Rate, and the Area Under the ROC Curve (AUC). The document uses these terms to help you assess how effectively a model performs and how much you can trust its predictions in a clinical setting.
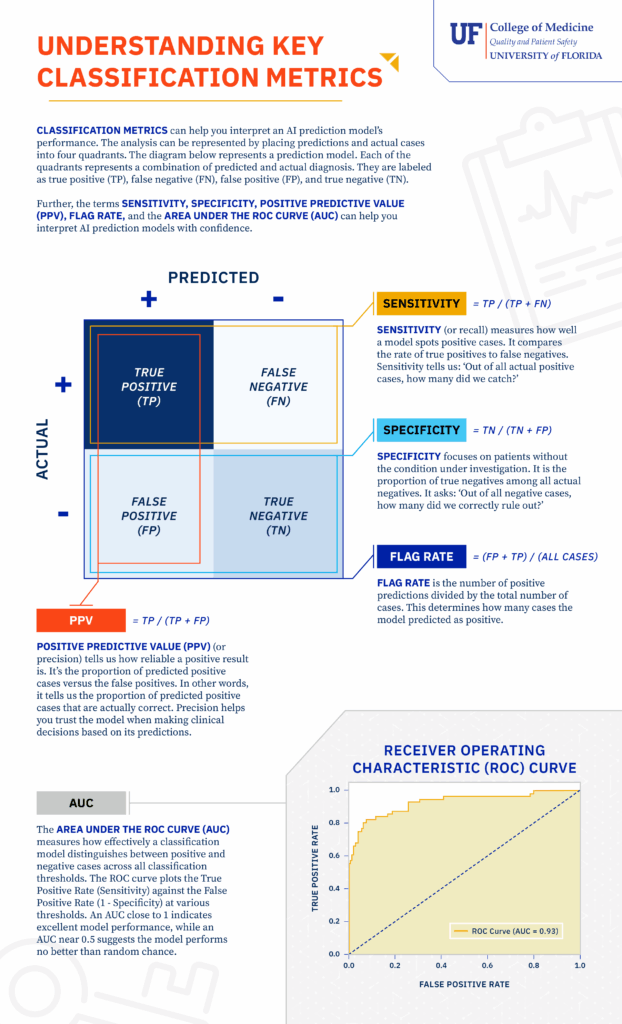
Download the Understanding Key Classification Metrics Infographic
Use this document for a comprehensive guide to understanding AI prediction model performance through a review of classification metrics:
- Define core classification metrics, including Sensitivity, Specificity, and Positive Predictive Value (PPV).
- Learn how the Area Under the ROC Curve (AUC) measures a model’s ability to distinguish between positive and negative cases.
- Understand the fundamental concepts of true/false positives and true/false negatives in model evaluation.
- Interpret the performance and reliability of AI prediction models in a clinical context.
Calculating Key Classification Metrics
In this video, learn how key classification metrics can help you interpret an AI model’s performance. Using a respiratory failure prediction model as an example, the video illustrates how sensitivity, specificity, flag rate, and positive predictive value (PPV) are calculated and how they inform clinical decision-making. The video also explains the Area Under the ROC Curve (AUC) and its significance in assessing a model’s overall accuracy. By understanding these metrics, you can confidently analyze a classification model’s results.