
What is a Cause-and-Effect Diagram?
A cause-and-effect, fishbone or Ishikawa diagram is a structured approach to identify and analyze the potential root causes of a specific problem. It is an essential tool for quality improvement and patient safety initiatives that helps healthcare teams focus on underlying issues rather than surface symptoms to pinpoint areas for improvement.
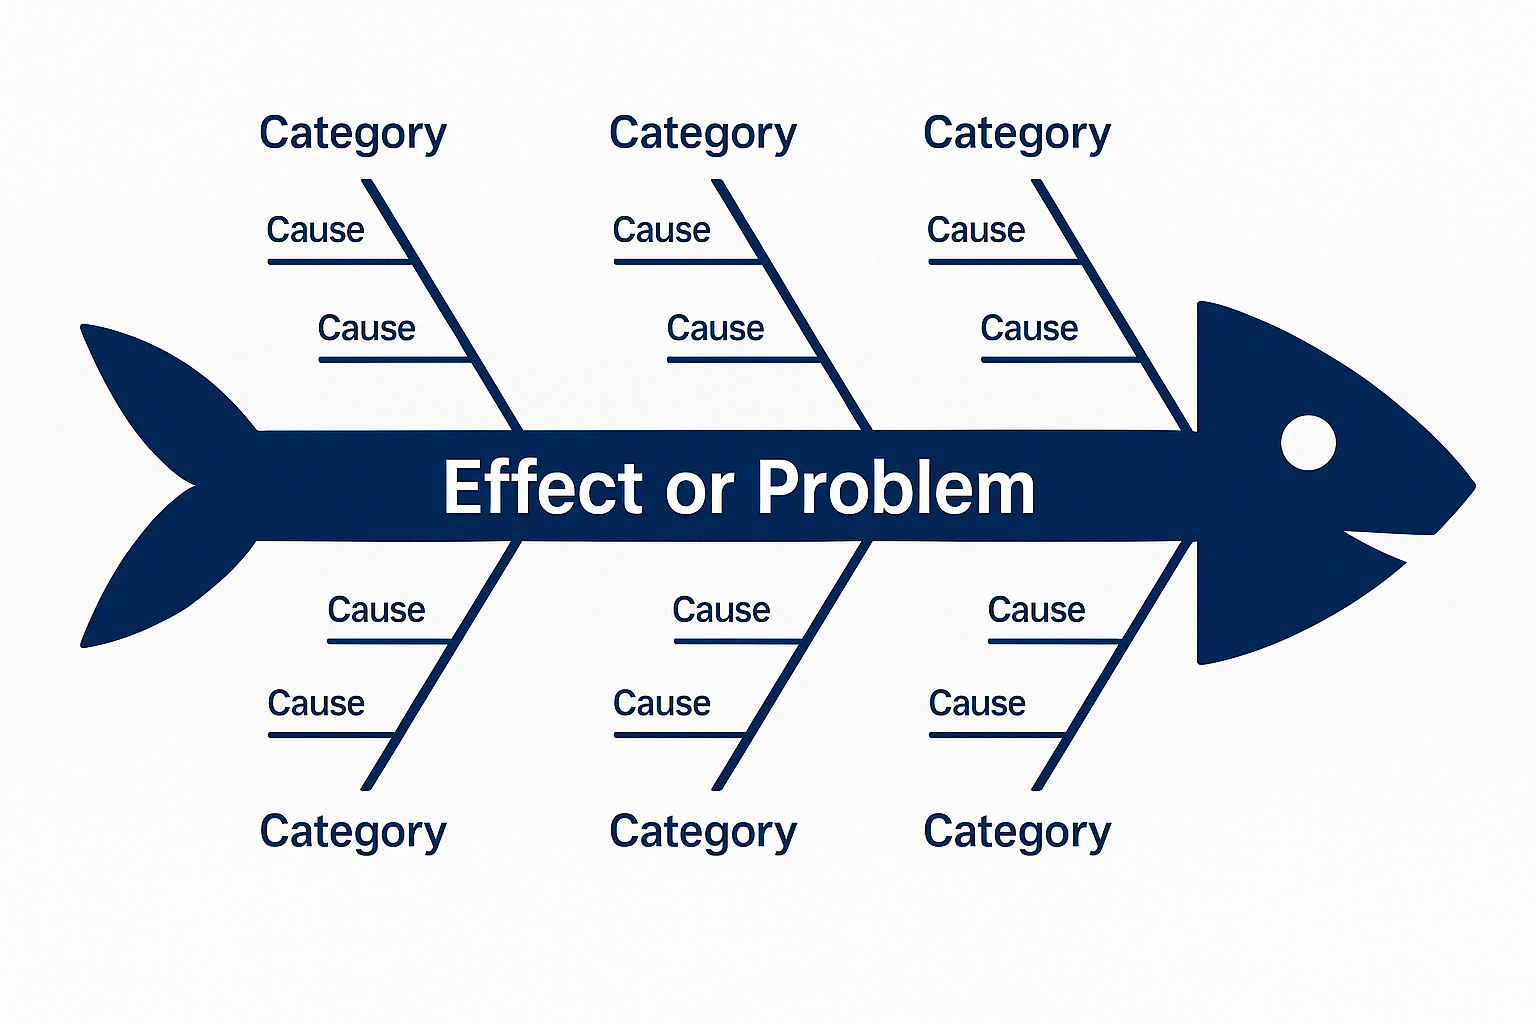
Often used as part of a Root Cause Analysis process, the cause and effect diagram resembles a fish skeleton (hence fishbone diagram), with the “head” representing the problem or effect and the “bones” representing the causes grouped in categories.
Completing a cause and effect diagram in the improvement process:
- Encourages diverse collaborations for a comprehensive analysis.
- Promotes systematic thinking by organizing causes into meaningful categories.
- Supports proactive problem-solving, focusing on identifying root causes rather than symptoms or placing blame.
Creating a Cause-and-Effect Diagram
- Define the Problem (Effect): Clearly articulate the issue to the right at the “head” of the diagram.
- Identify Major Categories: Group causes into broad categories.
- Often used categories include:
- Manpower (labor)
- Method (care delivery)
- Machine (including facilities, tools, systems, and equipment)
- Materials (items and physical resources use for delivering care)
- Mother Nature (external environmental factors)
- Measurement (Data, metrics, and inspections)
- Often used categories include:
- Brainstorm Causes: Collaborate with your team to identify possible factors within each category.
- Analyze and Prioritize: Highlight the most significant causes and prioritize them for action.
- Validate Findings: Verify with data or observations to ensure accuracy.
Resources
The Fishbone Diagram
In this brief video, Dr. Katharina Busl explains essential features of the Fishbone Diagram. This video is excerpted from the free CME course, Implementing a Change.