
 Katharina Busl, MD
 Nila Radhakrishnan, MD
What is a Fishbone Diagram?
The cause and effect diagram, also known as a Fishbone or Ishikawa diagram, is a visual tool used to explore the potential causes of a specific problem. By organizing ideas into logical categories, it helps teams move beyond obvious symptoms to find the underlying factors contributing to an adverse event or workflow inefficiency. Its strength lies in structuring a brainstorming session to ensure a comprehensive and balanced analysis.
While the diagram provides a powerful framework for group thinking, its output is only as good as the input from the team. It is a tool designed to harness and direct expert knowledge, not replace it. The diagram is a starting point for deeper investigation and is no substitute for trained clinical judgment and rigorous data validation.
Creating a Fishbone Diagram
1. Define the Problem (Effect): Clearly articulate the issue to the right at the “head” of the diagram.
2. Identify Major Categories: Group causes into broad categories.
Often-used categories include:
- Manpower (labor)
- Method (care delivery)
- Machine (including facilities, tools, systems, and equipment)
- Materials (items and physical resources use for delivering care)
- Mother Nature (external environmental factors)
- Measurement (Data, metrics, and inspections)
3. Brainstorm Causes: Collaborate with your team to identify possible factors within each category.
4. Analyze and Prioritize: Highlight the most significant causes and prioritize them for action.
5. Validate Findings: Verify with data or observations to ensure accuracy.
Resources
The assets below are designed to quickly get you up to speed. Watch the video for a dynamic overview of fishbone diagram concepts, and use the sample graphics to apply what you’ve learned.
The Fishbone Diagram
In this brief video, Dr. Katharina Busl explains essential features of the Fishbone Diagram, providing a clear, visual overview of its structure and use as a foundational quality improvement tool. This video is excerpted from the free CME course, Implementing a Change.
Transcript: The Fishbone Diagram
The cause and effect, or fishbone diagram, helps us visualize and analyze problems by identifying factors that contribute to or hinder success.
You may also hear the name Ishikawa diagram. This name is based on its original creator. As the name suggests, it visually mimics a fish skeleton. Imagine a fishbone. The problem is written on the right side with a horizontal line across the page.
Causes extend to the left as fish bones. These are factors, like methods, machines, materials, mother nature, measurement, and manpower, the six M’s that play a role in the problem.
This diagram is a basic quality tool and aids in brainstorming and root cause analysis. It sets out to identify many possible causes for an effect or problem, and aids to ideas into useful categories.
It can be used to structure a brainstorming session. It is also often used in product design and defect prevention.
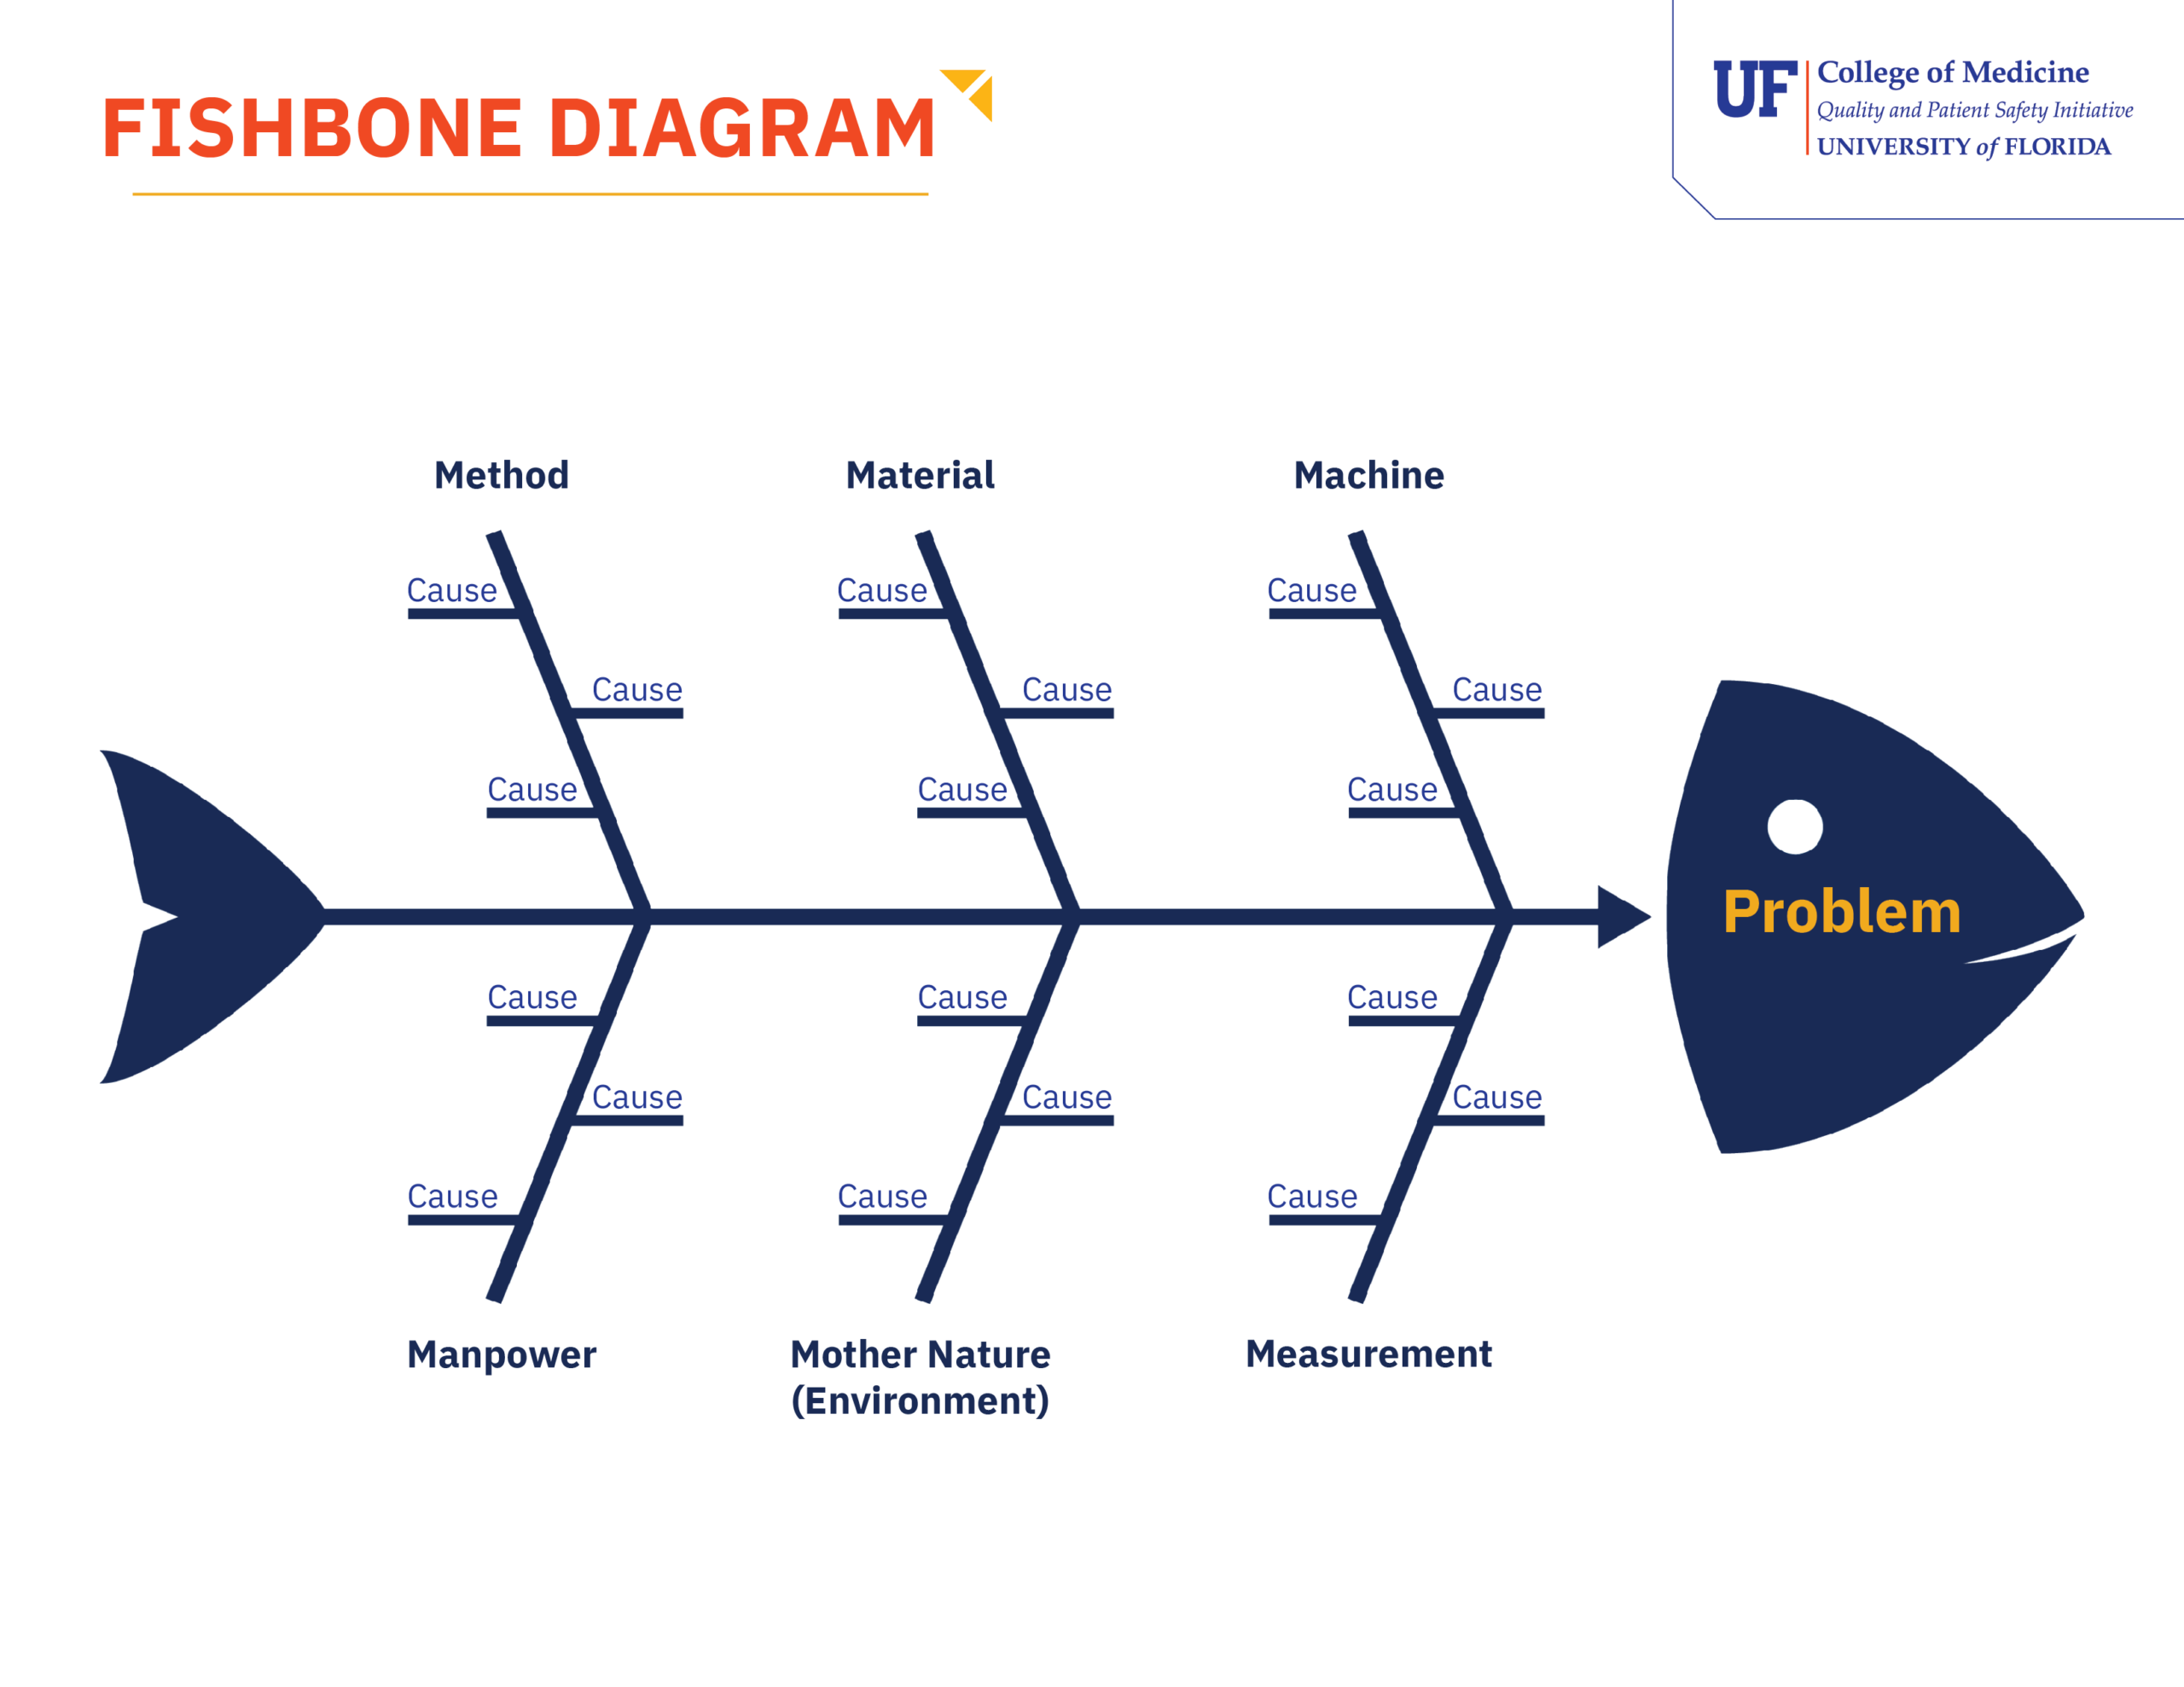
Fishbone Diagram (Sample)
This sample diagram references the “6 Ms” of causation — Manpower, Method, Mother Nature, Machine, Materials, and Measurement. Use it as a visual guideline to structure and facilitate a root cause brainstorming session with your team.
Worked Example: Applying the Fishbone Diagram to a Clinical Problem
The Problem
A medical-surgical unit has seen a significant increase in patient call light response times over the past two months. Patients are waiting an average of 12 minutes for a response — well above the unit’s target of 4 minutes. The charge nurse convenes an interprofessional team to investigate using a fishbone diagram.
Step 1: Define the Problem (Effect)
The team writes the problem clearly at the head of the diagram:
“Patient call light response time averaging 12 minutes — target is 4 minutes.”
Specificity matters here. A vague problem statement like “poor patient experience” would generate unfocused brainstorming. A precise, measurable problem statement keeps the team’s analysis anchored.
Step 2: Identify Major Categories
The team agrees to use the standard 6 Ms as their cause categories:
- Manpower
- Method
- Machine
- Materials
- Mother Nature
- Measurement
Step 3: Brainstorm Causes as a Team
The charge nurse facilitates the session with all relevant team members present — bedside nurses, a patient care technician, a unit coordinator, and a patient experience representative. Each person contributes observations from their own role and vantage point.
The team generates the following hypotheses across the six categories:
| Category | Hypothesized Causes |
|---|---|
| Manpower | Staffing ratios increased over the past two months; two experienced nurses transferred to another unit; float pool staff unfamiliar with unit layout |
| Method | No clear protocol for who is responsible for call light response when the assigned nurse is occupied; handoff process does not include outstanding call light requests |
| Machine | Two call light panels on the east corridor reported as intermittently malfunctioning; alert sound volume reduced after a noise complaint — staff may not be hearing alerts |
| Materials | Call light cords in four rooms too short to reach patients easily from the bed — patients delaying use |
| Mother Nature | Unit census has been consistently at or above 95% capacity for the past two months, increasing overall demand |
| Measurement | Response time data is only reviewed monthly — no real-time visibility for charge nurses during a shift |
Remember: These are hypotheses, not confirmed causes. The diagram reflects the team’s collective knowledge and observations — not a final conclusion. Each item requires validation before corrective action is taken.
Step 4: Analyze and Prioritize — With a Caution
Based on team discussion, the group identifies the causes most likely to be significant:
- No coverage protocol — every team member acknowledged uncertainty about who responds when the assigned nurse is unavailable
- Reduced alert volume — three staff members independently reported not always hearing the alert from the medication room
- Staffing ratio change — census data confirms the timing aligns with the increase in response times
The team does not act on these hypotheses yet. Instead, they assign two team members to validate each one:
- Pull staffing and census data for the past two months
- Audit call light alert volume settings across the unit
- Shadow two shifts to observe actual call light response patterns in real time
Step 5: Validate Findings
Data collection confirms three of the hypothesized causes:
- The coverage protocol gap is real — observation reveals that when the assigned nurse is occupied, call lights frequently go unanswered for the first several minutes
- Alert volume was reduced unit-wide, not just in one area
- Staffing ratios increased at the same time response times began to rise
The short cord length and malfunctioning panels are flagged as contributing factors but not primary drivers. The team brings validated findings to the unit QI project and uses an impact-effort matrix to prioritize corrective actions.
Connecting to Your QI Project: The fishbone diagram is most useful early in a PDSA cycle — during the planning phase, when your team is trying to understand why a problem exists before designing a change to test. It is not a standalone solution. Used well, it feeds directly into your driver diagram by helping you identify the primary and secondary drivers your intervention needs to address.
At a Glance: The Completed Fishbone
“Call Light Response Time: 12 Min Average (Target: 4 Min)”