
 Emily Weber LeBrun, MD, MS
 Overview
- Problem: A 15-year OR utilization rate of ~75% was costing the department patient access, efficiency, and institutional standing.
- Key Interventions: Corrected flawed hospital data, standardized scheduling, introduced anonymized peer benchmarking, and created an internal marketplace for unused block time.
- Results: Utilization rose to ~96%, sustained over nine months, with a net 56% increase in OR block allocation.
- Key Lesson: Data integrity and transparent accountability — not process changes alone — are what drive lasting improvement.
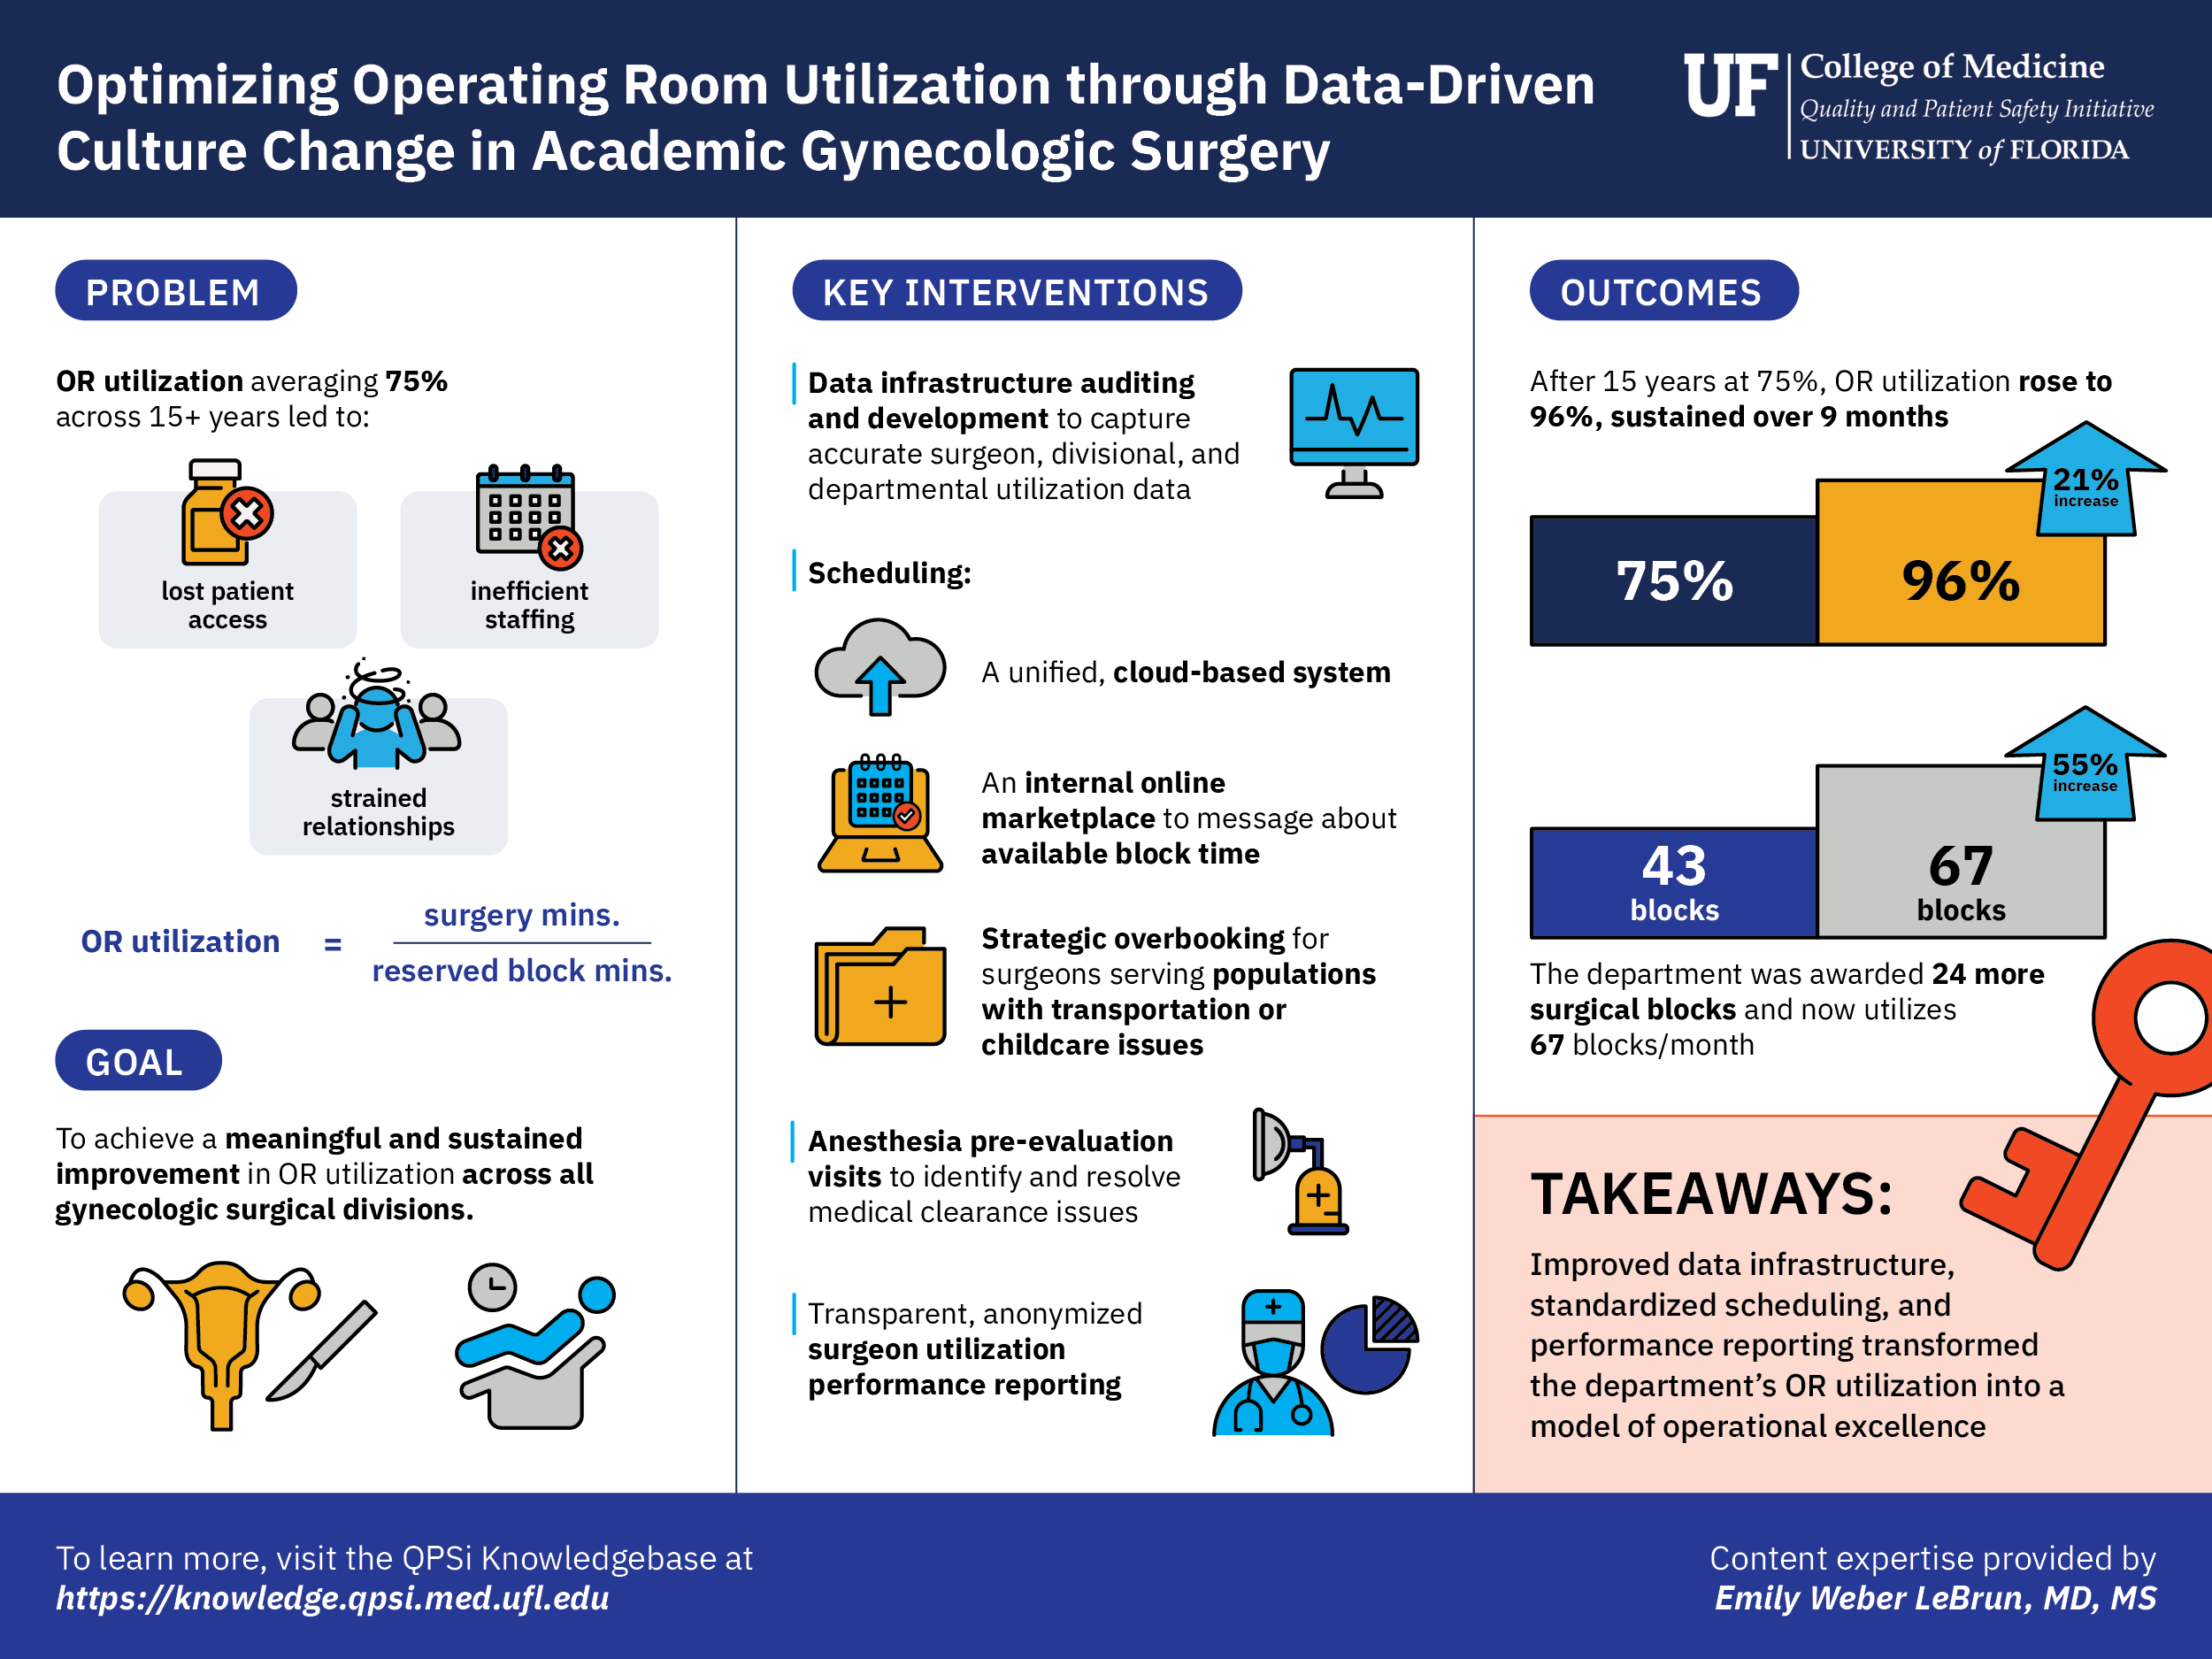
Image: OR Utilization Visual Summary
Case Summary
At the University of Florida College of Medicine, Department of Obstetrics and Gynecology, OR utilization had stalled at 75% for 15 years — leaving surgical capacity unused, patients waiting, and resources wasted. By building trustworthy data infrastructure, standardizing scheduling practices, and releasing anonymized performance data to surgeons, the department drove utilization to 96% and nearly doubled its OR block allocation. The key insight: culture doesn’t change until people can see themselves in the data.
Setting & Context
This initiative took place within the University of Florida College of Medicine’s Department of Obstetrics and Gynecology, a large academic surgical department managing five subspecialty divisions — Urogynecology, MIGS, GYN Oncology, ASGOG, and MFM — across a main OR and a surgical center environment. The work was led by Dr. Emily Weber LeBrun, Professor and Chief of Urogynecology and Reconstructive Pelvic Surgery, Director of Surgical Services, and Physician Director of Quality, supported by an operational effectiveness specialist, departmental administrative leadership, surgical schedulers, and Epic and REDCap data builders. Their patient population spans the full spectrum of gynecologic surgical care, including patients with complex medical needs, social vulnerabilities, and varying access to preoperative support.
Problem & Aims
The operating room is among the most resource-intensive environments in a hospital, requiring coordination among approximately 25 or more people — including anesthesia, nursing, surgical technologists, environmental services, pharmacy, scheduling, and the surgical team — for a single case. When reserved block time goes unused, the financial cost is compounded by a human one: a patient who needed surgery that day did not receive it. For the UF Department of OB/GYN, this was not an occasional problem — it was a 15-year pattern, with OR utilization persistently hovering around 75%.
The department set out to achieve a meaningful and sustained improvement in OR utilization across all surgical divisions, with a parallel goal of building the data infrastructure needed to accurately track performance at the individual surgeon, divisional, and departmental levels. Critically, the team recognized that improvement could not begin until the data itself was trustworthy — and that required confronting significant gaps in how the institution was capturing and reporting OR activity.
QI Strategy & Changes
The initiative unfolded in three overlapping phases.
The first was a quiet, multi-year effort to build a parallel departmental database using REDCap, Epic, and Qgenda — tools selected to capture what the hospital’s existing system could not: individual surgeon performance, shared block accounting, late cancellations, insurance pre-authorization failures, and conflicts such as faculty committee obligations. This audit revealed that some gynecologic cases had been miscoded as obstetric, effectively erasing them from the department’s utilization calculation. Correcting these errors was a prerequisite to any credible improvement effort.
The second phase focused on operational standardization. Fragmented scheduling practices — paper calendars, post-it notes, text messages, and siloed email threads — were replaced with a unified, cloud-based scheduling system, ensuring all schedulers and surgeons worked from the same real-time information. An Epic OR Marketplace was developed to allow surgeons and schedulers to communicate about available block time, enabling high-volume surgeons to claim unused capacity from colleagues. Population-specific scheduling strategies were introduced for faculty serving patients with higher cancellation rates due to social determinants of health, using strategic overbooking to protect utilization without compromising patient access. Proactive anesthesia pre-evaluation, coordinated approximately one month before surgery, was implemented to reduce day-of cancellations from unresolved medical clearance issues.
The third and most catalytic phase was the release of anonymized, transparent performance data to the surgical faculty. Each surgeon was assigned a de-identified number and received a color-coded utilization table — green for strong performance, red for areas needing improvement — updated regularly and distributed across the department. This single intervention produced an immediate and dramatic shift in faculty engagement and scheduling behavior.
Impacts & Outcomes
Following the release of transparent utilization data, OR utilization rose from a 15-year baseline of approximately 75% to approximately 96%, sustained over nine months. The demonstrated improvement, coinciding with a strategic OR renovation, resulted in the department being awarded 36 additional OR blocks per month — growing from 43 to 67 blocks per month. The department voluntarily returned 12 blocks upon recognizing the award exceeded actual need, a decision that generated significant institutional goodwill and trust.
Divisional utilization as of January–June 2024 stood at: MIGS 90%, Urogynecology 81%, GYN Oncology 79%, and ASGOG 70%, with release rates of 22%, 28%, 14%, and 24% respectively.
Practical Insight
The core challenge:
OR utilization data is often inaccurate, incomplete, or inaccessible at the level that actually drives behavior — the individual surgeon. Without reliable data, improvement efforts lack both direction and accountability.
What worked:
- Build your own data before acting on institutional data. A parallel database takes time, but it earns trust and reveals blind spots the existing system cannot see.
- Anonymized peer benchmarking is a low-risk, high-impact culture lever. Surgeons respond to seeing themselves relative to peers — even without names attached.
- Embed accountability in the workflow. Weekly meetings, cloud-based scheduling, and an OR Marketplace keep performance visible and actionable rather than retrospective.
- Design for your population. Surgeons serving patients with social barriers to care need scheduling strategies that account for higher cancellation rates — overbooking is not a workaround, it is equity-informed planning.
- Block assignment strategies are not one-size-fits-all. Open blocks, booking date priority, and case volume approaches each favor different divisions and must be evaluated continuously.
Common barriers and how the team addressed them:
- Resistance to change: An external operational effectiveness specialist — someone without a stake in existing practices — was instrumental in understanding legacy workflows and building trust across schedulers and faculty.
- Data distrust: Years of parallel data collection provided the evidence base needed to correct institutional reporting errors and establish credibility before asking anyone to change behavior.
- Sustaining gains: Block assignments are reviewed every six months, and the OR Marketplace provides a continuous mechanism for self-correction without requiring top-down intervention.
Resources
The following video resources featuring Emily Weber LeBrun, MD, MS guide the viewer through the full arc of this OR optimization initiative — from the mindset behind the work to the interventions, results, and future direction. A visual summary of the case study is also available for download.
Why QI? The Mindset Behind the Work
Dr. Weber LeBrun reflects on the personal and professional origins of her quality improvement philosophy — from childhood habits of self-assessment to her conviction that every patient experience should contribute to better care for the next. This video sets the foundational mindset for everything that follows in the case study.
Transcript: Why QI? The Mindset Behind the Work
My name is Emily Weber Lebrun. I’m the professor in chief of urogynecology and reconstructive pelvic surgery at the University of Florida. I’m also the physician director of quality and the director of surgical services for the department.
My beginning in quality improvement work probably started as a child. I grew up with a father who’s a pediatric endocrinologist and also German. So very high standards and everything was about getting better, every time you try something new, even something as simple as riding my bicycle to school 2 or 3 miles down the road. Did you come with your, you know, tire kit? Did you have all the things that you needed for your after school activities? Were you dressed appropriately for the weather? And every time we went on that trip, we would assess, like, did we do what we were supposed to do? Did we do it in time?
Did we allocate enough time for that activity? And so all that independent sort of programmed, but also independence kind of gave me the foundation for continual self-assessment. Key work is important to me because probably because of that foundation of education in my family, in which every experience really should inform a future experience to be better than it could have been without that information.
And so as I went through my medical training, I felt very strongly that every patient experience should contribute to the wall of science or to the wall of improvement, basically a block in that wall, so that we can continue to improve the care for women despite what may be approved by the FDA or not approved. And the surgeon in particular has a very important role to sort of check their ego at the door and assess their outcomes objectively as much as possible.
A Thousand Cases: QI in Action at the Bedside
Drawing on her first thousand surgical cases at the University of Florida — where she arrived as the institution’s first urogynecologist with no surgical mentors — Dr. Weber LeBrun describes how systematic self-audit led to measurable improvements in mesh erosion rates, postoperative admissions, and resident education. She also recounts how consolidating 20 surgeons’ individual instrument trays into a single standardized tray reduced sterilization costs, instrument count time, and unnecessary post-operative X-rays.
Transcript: A Thousand Cases: QI in Action at the Bedside
I can tell you a little bit about the beginnings of my quality improvement work. As a urogynecology fellow, which is a three-year fellowship after an OB/GYN residency, I started the first surgical mesh registry. Use of mesh and vaginal surgery was somewhat controversial at the time, and so I wanted to understand what the controversy was about and whether the data supported that controversy. So I built a national mesh registry, and that gave me the foundation for monitoring my own outcomes over time.
So I found opportunities to adjust my surgical instruments. One of the very specific things that happened is, in my first six years, I looked at my first thousand cases. I did not have any surgical mentors. I was the very first urogynecologist hired at the University of Florida, and I didn’t have anyone to sort of bounce my ideas off of, nor to compare my outcomes to. And so those first thousand cases were very instrumental in identifying opportunities. One opportunity was complications of a mesh erosion from slings. Another was post-operative admissions. Another was educating residents in vaginal surgery.
And those three things in particular, I was able to identify that my mesh erosion rate was acceptable for national rates, but not quite at the level that I wanted to be above, you know, better than national rates. I also identified that some of my patients were being admitted after surgery for problems that really didn’t merit a hospital admission, things like constipation or UTI that should have been better managed with improved patient preparedness.
So me educating them a little bit better, and also with instructing my residents a little bit better to teach the patients and have them know what merits an admission. So by changing my surgical instruments, by changing how I engage residents in my practice, and also by improving my patient education, I was able to drop my mesh erosion rate from about 3% to 1 in 800, as well as decrease my admission rate from 3.4 to 1.7. And the patients were much happier with their improved education.
A process that I was involved in that made our lives better in QI related to the use of surgical instruments, when I came to the University of Florida, there were about 20 faculty, and many of those faculty all did hysterectomies, but they all had their own individual surgical tray. There was a tray for each surgeon, maybe 3 or 4, because they might do 3 or 4 cases in a day. But each surgeon’s trays had different instruments and they had all added instruments over time. Oh, I like this. This is a new thing. Let me try that.
So when I arrived, I found this out and said, this seems like an opportunity for improvement. So I consolidated all of the instruments into one tray. We removed about 300 instruments from a single tray, which means way less cost in sterilization, way less time for the surgical scrubs to count those instruments, and way fewer X-rays, which is a thing that we do after surgery if we miss an instrument or we misplace it. Sometimes we’ll do an X-ray even when the count was correct, but we couldn’t find an instrument. Maybe it was missing from the tray in the beginning.
So by consolidating the trays into one single tray for all faculty, it made it so much easier for the staff in the room. Made sure that all the faculty agreed with this new tray and then we implemented it. So now we have, you know, 20 or 30 of the identical trays. And it has really improved the satisfaction of our nurses in the O.R. and the surgical scrubs in the O.R.
Understanding OR Underutilization
Dr. Weber LeBrun defines OR utilization as the number of minutes of surgery divided by the number of minutes of reserved block time, explains the full human and financial cost of unused block time, and describes the 15-year pattern of 75% utilization that made improvement both urgent and overdue. She outlines her initial approach: building a parallel departmental database to verify the accuracy of institutional data before taking any action.
Transcript: Understanding OR Underutilization
So in our operating room optimization quality improvement project, we were trying to improve our O.R. utilization. And what that means is the amount of time that we’re actually operating in the O.R., compared to the amount of time that we’re given by the hospital.
The operating room is an extremely expensive and highly necessary resource. It’s not only the real estate of the room and all of the technology within that room, but it’s also the nursing staff, the environmental services staff that clean it, the anesthesiologist. All of that combined into one. It takes about 34 people to get one patient from the beginning of surgery to the end of surgery. And so if we are given that resource by the hospital, but then we don’t have a patient using that resource, it’s extremely expensive.
Not to mention the fact that there’s probably someone at home wishing that they had an opportunity for surgery that day and that opportunity is lost. So we had about a 15-year history in our department of about a 75% utilization, which was really unacceptable. And the hospital had been quite gracious in giving us some liberty due to changes in staffing and changes in faculty, but we really needed to tighten up our process.
The importance of optimizing the O.R. speaks not only to physicians being able to be used in the most effective way. If we have surgeons but they don’t have surgery, then they are not being used at the top of their license. And of course, the staff and the resource that goes into the operating room is important to use so that our efforts are being put forth in a good, you know, sort of good will, good fashion.
Initially, the goal was to ensure that the data that was being provided by the hospital was accurate and consistent, and that it matched the data that we experienced from a departmental level. So the first thing I did over about three years, so I built a parallel database and I collected that data, the same things that the hospital was doing, but with the lens of our department. And that helped me know that we were going to be chasing the same rabbit, so to speak.
From Post-it Notes to the Cloud: Fixing the Process
This video covers the operational core of the initiative — how the data audit exposed miscoded cases and systemic gaps in institutional reporting, how scheduling was modernized from fragmented analog practices to a unified cloud-based system, and how the release of anonymized, color-coded surgeon utilization data produced an immediate and dramatic shift in faculty behavior and OR performance.
Transcript: From Post-it Notes to the Cloud: Fixing the Process
Well, the audit actually provided some really helpful information. We found that there were some misalignments in the coding of some of our surgical cases. Some of the cases had been coded as obstetric when really they were gynecologic. And so they were being eliminated from our counting mechanism. So I actually was able to use the hospital-based data collection tool to more accurately reflect what was happening in the O.R.
Another thing that that process allowed us to do was identify situations that were unique to our department that contributed to low utilization. Some examples might be things like if a patient had trouble getting access to transportation or child support, and they needed to cancel their case, but it was sort of at the last minute before another person could be put into that spot. Sometimes faculty have other activities that they do, and if they’re asked to participate in a committee or a meeting and it’s during their operative day, then they might have a break in their operative day, which would then lower their O.R. utilization.
So we were able to collect data about those certain types of circumstances, which allowed us to then troubleshoot and say, well, let’s not give someone an O.R. day when they also have a committee meeting, or let’s improve our process of preauthorization for insurance so we don’t get insurance denials very late in the day before, you know, a surgery that happens. That really helped us improve many of our processes.
So the information that that audit gave us was critical to the next step of our process. And that involved changing behavior and changing the activities that 20 faculty, 20 residents, and more than eight surgical schedulers had been doing for years, and handing down generation after generation. So we were able to influence and change some behaviors.
For example, there were some people who were using paper calendars in 2010. There were others using post-it notes, emails, or even text messages to communicate between surgeons and schedulers. There was a very limited dependence on electronics and technology. And what that resulted in is that different schedulers were not aware of what others were doing.
And so by functioning, as we now know, in 2026 on a cloud-based system, everybody can see what’s happening within that cloud. In 2010, that wasn’t a culture of technology in scheduling for surgery. So that made a really big difference in making sure that everybody was working in the same way.
The next really important element for this process to work was sharing of the data, both the individual data for each surgeon and the division data. So within a department, there are different surgical divisions that have different performance needs, different types of patients, and may have different types of outcomes in terms of their O.R. utilization. So we were able to share the data for the entire department with all of the surgeons in both an anonymous and a transparent way.
So there would be a graph, basically a table, in which every surgeon was given a number. And their O.R. utilization was then tracked month by month for that individual surgeon. So on a table there would be four columns. The first column would be the surgeon with their de-identified number, and then each subsequent column would be their personal utilization for that time period. And they were color coded to make things easy, green being good and red being not so good.
And then for each email that was sent out to the individual surgeons, they were given their own personal number so they could see, oh, I’m number nine and I have an 88% utilization. Oh, I feel pretty good about that. Oh, but there’s another surgeon who’s 92.
And so it sort of bred a little bit of competition. But in an anonymous yet transparent way, even surgeons can be fairly competitive with each other and even within themselves. And so that moment in time really produced a dramatic change in the culture and the performance of surgeons and the buy-in of surgeons themselves to optimize their own O.R. days.
Changing Culture: The Hardest Part of QI
Dr. Weber LeBrun addresses the hardest part of any improvement initiative: changing entrenched behavior at scale. She describes the critical role of an external operational effectiveness specialist in building trust across schedulers and faculty, and walks through three practical solutions — proactive anesthesia pre-evaluation, population-specific overbooking strategies for surgeons serving vulnerable patients, and the Epic OR Marketplace for real-time block time communication.
Transcript: Changing Culture: The Hardest Part of QI
The biggest challenge with implementing a change such as this for our utilization is really affecting culture, and it could not have been possible without the help of an expert in operational effectiveness. We hired a dedicated person to meet with us on a weekly basis, touch base with all of the schedulers, as well as the surgeons to understand their processes of post-it notes and text messages and all of the different analog ways that they were functioning and why they were choosing to function in that way. What advantages was it giving them over another strategy?
In that way, we were able to have a person who was not myself, who was not sort of in the mix and potentially controversial, really didn’t have a dog in the fight per se. They were working on process improvement. It took a long time to work those process processes out, but it was super important to have an expert in that, something that probably any one of us from the inside could not have done on their own. That made a huge difference. Implementing this in practice really blossomed in several ways.
One example would be patients are sometimes needing medical optimization and without knowing that ahead of time, sometimes patients would get canceled on the day of surgery if they were susceptible to infection, or didn’t quite have the cardiac sufficiency that they needed to undergo anesthesia. So coordinating those visits with anesthesia for medical optimization, a good month before the planned surgery, became a really important tool that we used that really helped our late cancellation rate.
Similarly, we have some faculty who really serve a very vulnerable population. Individuals who lack transportation, lack childcare, some of the social supports that others enjoy. Those surgeons then, of course, will have a higher cancellation rate or a no-show rate. And so by stacking those sometimes shorter cases a little bit higher on the number of cases per day, so maybe even overbooking that surgeon will allow for a 10 or 20% cancellation rate not to wreck an O.R. utilization day. And that way, patients are still getting cared for. But we aren’t letting social challenges impact the care of other patients. So that was really helpful.
We also developed an online marketplace, which is basically a way for us to communicate between ourselves, surgeons and schedulers about available O.R. time. So if I, as a high-volume surgeon, needed more time than I wasn’t scheduled for, I could sort of go shopping on the available schedule and pick up overtime that somebody else wasn’t using. That really improved our utilization as well.
OR Optimization: Results, Lessons, and Future Plans
Dr. Weber LeBrun presents the results: a jump from 75% to 96% OR utilization sustained over nine months, growth from 43 to 67 OR blocks per month, and the institutional goodwill generated by voluntarily returning 12 blocks the department didn’t need. She reflects on the importance of broad team ownership for sustained improvement and describes the department’s next chapter — transitioning from a parallel departmental database to EMR-native reporting as new Epic analytics tools become available.
Transcript: OR Optimization: Results, Lessons, and Future Plans
It’s always good to know if things work right. We knew that we were successful with this project really in the data, so we had about a 75% O.R. utilization for 15 years. The very moment that we anonymized and distributed the data to the surgeons, transparently but carefully, there was a dramatic change in the behavior of the surgeons and their schedulers. We were able to then maintain about a 96% O.R. utilization sustained over nine months, which is just a huge testament to the fact that we did the necessary sort of background work. And then when everything, all the processes were in place, then we sort of pulled the trigger on culture and the process was there to support that culture change.
What that resulted in for our department is that we had 43 O.R. blocks per month at our use at that time. With the additional improved O.R. utilization and coincident with strategically a renovation of the O.R.’s, we were awarded 36 new blocks per month for our department, almost 100% increase in access to O.R.’s, which is unheard of. Now, interestingly, and admittedly, it was a little bit more than we really needed.
Over the ensuing 3 or 4 months, we noticed a drop in our utilization, really focused on releasing rooms that we didn’t need. And so we as a department and as an institution adjusted our block needs. So we gave back 12 of the blocks that we had been given just because it was a little bit of a, a too big of an ask and a too big of a reward. But that resulted in lots of good sort of goodwill within between the department and the institution. They can trust us that if they, if we ask for something, we need it. And if we are given too much, we’ll give it back without difficulty. So that was a very powerful moment.
The demonstration of this can be seen really well on a graph. What we did is over time from 2020, across the x axis to 2024, we mapped out our utilization and we did it by location. So over the y axis we have our percent utilization. Over the x axis we have time. So the north tower, which is where most of our surgeries happen and all of our overnight stays happen, as well as a surgical center environment. And so we are looking at those data separately, and we can see the ebbs and flows of utilization over that time period. Hovering consistently around 75% for the majority of that time.
And then a very focused point, pivotal point at the time that we published the data to our department, where you see all of the lines coalesce in one single point and then go high from 75 to 95% across locations and over time. And so that really demonstrated, you know, that tremendous change. If we focus in on that time a little bit on the subsequent graph, we can see the impact of the gift of 3600 hours, as well as the impact over time of having a little bit more than we needed. And so by seeing the release time go up and the utilization go down a little bit. We were able to right size ourselves, and we’ve been right sized ever since.
The most important lesson I learned from this project would be said by my previous chair of having a lot of fingerprints on the task, meaning having lots of people involved. A project that is really spearheaded by one person and executed by one person has a more higher chance of failing because not everybody is involved. But when people get involved, you ask their opinions and you get them to participate in the solution. They’re much more committed to that culture of change that’s required for sustained improvement. With broader team support, it’s a bit easier to do things in a more efficient way when doing a project on one’s own, as I said earlier, it’s hard to get buy in from other people.
And so now what’s great is we have a team of people who are all committed to the activity, and it’s a good chance to sort of jump off on a new project with that group. Having the trust, the track record and the culture already sort of in line. Um, when you have a big team, sometimes it can get messy and there’s lots of ideas, but it’s all those ideas that actually make the outcome more rich and more productive and also more likely to stick.
For this work of O.R. utilization, we currently are maintaining still our own department database that we use in parallel with the data that’s generated by the hospital. That’s a lot of work, and I have an admin person who does that work for us. But her time could be better used doing something else if it was truly duplicated effort. This week, actually, our electronic medical record went through a modernization upgrade, sort of like 2.0, and new tools and data analytics have become available as a result of that modernization.
We’re going to be able to get individual surgeon data about utilization now, where before we were not able to get that data. So I’m hopeful that the next chapter will be, again, auditing the data that is produced by the EMR to make sure that it’s correct, that it aligns with the data that we’re collecting on ourselves. And once that’s established, retiring the work that we have done as a parallel adjunct to the existing data that runs the hospital in this way, we’ll have come full circle from using electronic medical record data that was flawed, improving that process for the hospital, making sure that we were improving ourselves along the way, and now being able to put that chapter behind us and rely again on data driven by the hospital.
Visual Summary: Optimizing Operating Room Utilization
This downloadable infographic provides an at-a-glance overview of the problem, goal, key interventions, outcomes, and takeaways. Use it as a quick reference when planning a similar initiative.
Acknowledgements
This work would not have been possible without the dedication of the entire surgical services team. Special thanks to Department Chairman Dr. John Smulian for his sustained support throughout the initiative; LaKesha Fountain for her expertise in operational effectiveness; administrative assistants LeeQuisha Johnson and Jay McNair; schedulers Sherea Mosley, Kayla Carpenter, Angel Adkins, Dara Fowler, Renah Ward, Toni Richardson, Kim Brownell, and Iechia Houston; Epic and REDCap builders Jason and Stephanie; and departmental leadership Sandra Johnson, Jocelyn Dola, Robyn Broxton, and Donna Niehaus.