

What are SMART Goals?
Every successful quality improvement project begins with a clear destination. Vague objectives like “improve patient safety” or “reduce wait times” are good starting points, but they don’t provide the specific, actionable direction a team needs to make progress. This is where the SMART framework comes in. It is a simple tool for turning broad aspirations into a focused objective that everyone on the team can understand, rally behind, and measure.
SMART is an acronym that stands for Specific, Measurable, Achievable, Relevant, and Time-bound. By applying these five criteria, you can craft a powerful aim statement that acts as the “north star” for your project. A SMART goal clarifies exactly what you want to accomplish and why it’s important (Specific, Relevant), how you will know you’ve succeeded (Measurable), whether it’s realistic (Achievable), and when you expect to accomplish it (Time-bound). This process eliminates ambiguity and provides the focus and motivation needed to drive meaningful change.
Resources
The resources below provide clear examples and practical guidance to help you master the SMART framework. Use them to write effective aim statements that will set your own quality improvement projects up for success.
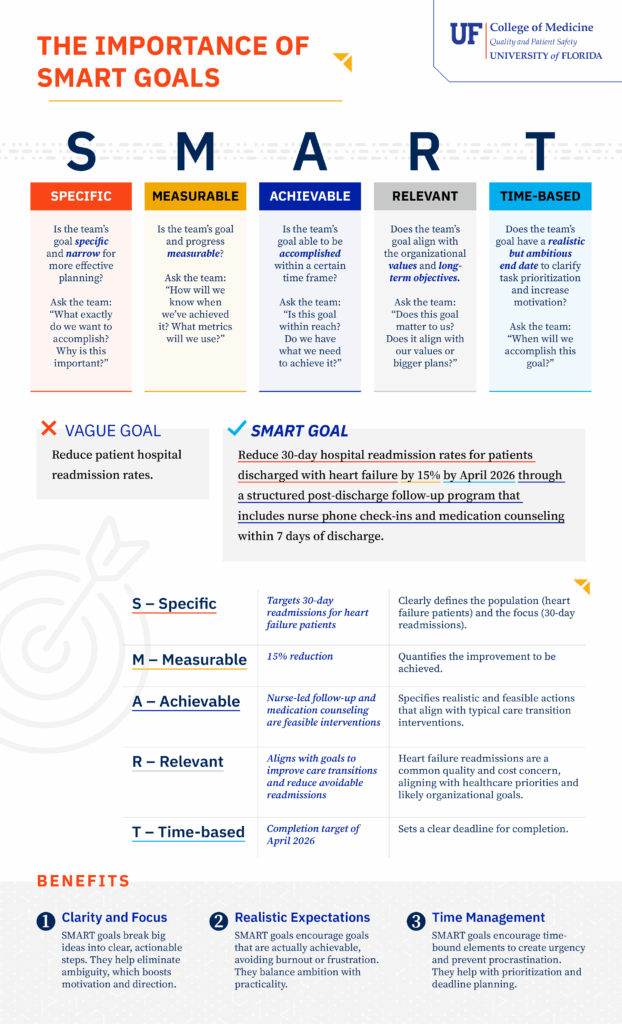
The Importance of Smart Goals
Use this downloadable infographic to learn the fundamentals of the SMART goal framework. It provides key questions for each component, breaks down a detailed clinical example of reducing readmissions, and outlines the benefits of creating clear, actionable goals.
Visualize the Basics of SMART Goals
This downloadable guide will help you:
- Understand the components of SMART Goals
- See the benefits of SMART Goals
- See examples of SMART Goals in healthcare
SMART Goals
This video demonstrates how to craft a clear, measurable, and achievable goal for a quality improvement project. Learners will see how each element of a SMART aim—specific, measurable, achievable, relevant, and time bound—applies in practice through a medication safety example.